%20(1)%20(1)%20(1).png)
Monitoring and alerting play a crucial role in cloud-native environments, ensuring the smooth operation and performance of applications running on Amazon (AWS) EKS. By implementing a robust AWS EKS monitoring and alerting system, businesses can;
- Gain valuable insights into their infrastructure.
- Detect issues in real-time.
- Proactively address potential bottlenecks or failures.
Prometheus and Grafana offer a powerful combination for monitoring and visualizing data on AWS EKS. Prometheus, a popular open-source monitoring tool, provides flexible and scalable metrics collection, enabling businesses to gather metrics from various sources within the AWS EKS cluster.
Grafana, on the other hand, offers a rich and intuitive dashboarding platform, allowing users to create visually appealing and customizable dashboards to monitor the collected metrics effectively.
Table of Contents
- Benefits of AWS EKS monitoring with Prometheus and Grafana
- How to set up Prometheus and Grafana for AWS EKS monitoring
- How to configure Prometheus to collect AWS EKS Cluster metrics
- How to create dashboards in Grafana
- Implementing AWS EKS alerts with Prometheus and Grafana
- AWS EKS monitoring best practices
- Importance of AWS EKS monitoring
- Conclusion
Benefits of AWS EKS Monitoring with Prometheus and Grafana
With Prometheus and Grafana, businesses can benefit from:
- Real-time Visibility: Monitoring tools like Prometheus provide real-time metrics collection, enabling businesses to have immediate insights into the performance and health of their containerized applications on AWS EKS.
- Efficient Troubleshooting: Prometheus allows businesses to store historical data, enabling you to analyze trends and identify patterns that can help in troubleshooting and root cause analysis of issues that may arise within the AWS EKS environment.
- Customizable Dashboards: Grafana empowers users to create visually appealing and customizable dashboards that consolidate metrics from multiple sources. This enables businesses to have a comprehensive view of their infrastructure and applications, making it easier to monitor and analyze performance.
- Alerting and Notifications: Prometheus supports the creation of alerting rules that can trigger notifications when specific conditions are met. This allows teams to proactively respond to potential issues or anomalies, minimizing downtime and ensuring the reliability of their applications.
By leveraging the capabilities of Prometheus and Grafana on Amazon EKS, teams can enhance their monitoring and alerting capabilities, leading to improved performance, increased reliability, and better overall management of their cloud-native infrastructure.
How to Set Up Prometheus and Grafana for AWS EKS Monitoring
1.1 Create an AWS EKS Cluster: Set up an Amazon EKS cluster using the AWS Management Console or AWS CLI. This involves creating an AWS EKS cluster with the desired configuration, such as the number and type of worker nodes.
1.2 Install and Configure Helm: Helm is a package manager for Kubernetes that simplifies the installation and management of applications. Install Helm on your local machine and configure it to connect to your AWS EKS cluster.
1.3 Add Prometheus Repository: Add the Prometheus Helm chart repository to Helm, which contains the necessary files and configurations to deploy Prometheus on your AWS EKS cluster. Use the following command:
1.4 Install Prometheus: Use Helm to install Prometheus on your AWS EKS cluster. Run the following command:
This command will deploy the Prometheus server and its components in your cluster.
1.5 Expose Prometheus: By default, Prometheus is not accessible from outside the cluster. Expose Prometheus using a Kubernetes service of LoadBalancer or NodePort type to allow external access. Then, modify the Prometheus service configuration accordingly.
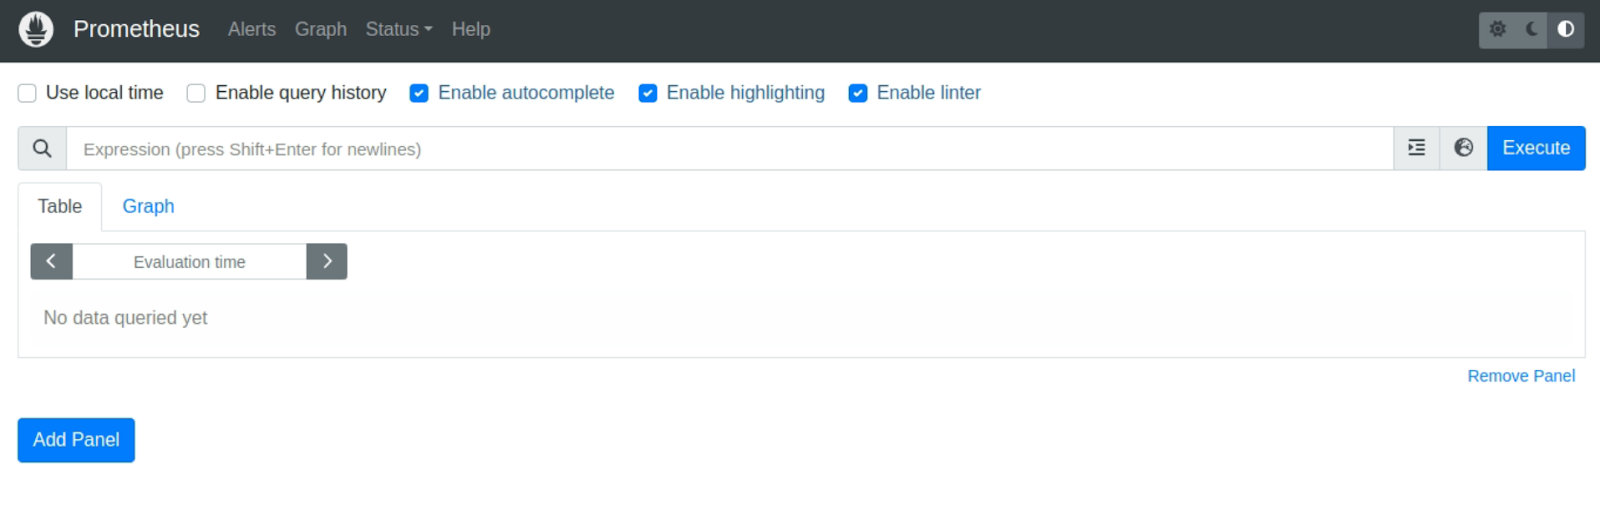
1.6 Verify Prometheus Installation: Ensure that Prometheus is running successfully by accessing the Prometheus UI. Use the LoadBalancer or NodePort URL to access the Prometheus dashboard in your web browser.
1.7 Add Grafana Repository: Similar to Prometheus, add the Grafana Helm chart repository to Helm using the following command:
1.8 Install Grafana: Install Grafana on your AWS EKS cluster using Helm. to do so, run the following command:
This command will deploy the Grafana server and its components in your cluster.
1.9 Expose Grafana: Expose Grafana using a Kubernetes service of type LoadBalancer or NodePort to make it accessible externally. Next, adjust the service configuration to enable external access to the Grafana UI.
2.0 Configure Data Source: Configure Prometheus as a data source in Grafana. Specify the URL of the Prometheus server that you deployed earlier. This enables Grafana to fetch metrics data from Prometheus.
2.1 Create Dashboards: Use the Grafana UI to create custom dashboards. Explore the available visualizations and create panels to display metrics from Prometheus. You can customize the dashboards to suit your AWS EKS monitoring needs.
2.2 Configure Alerting: Set up alerting rules in Prometheus and configure Grafana to send notifications based on those rules. Define thresholds and conditions for triggering alerts when specific metrics exceed predefined values.
Be sure to configure appropriate notification channels, such as email or Slack.
2.3 Test and Monitor: Validate the setup by generating sample data or simulating scenarios to ensure that the monitoring and alerting system is working correctly. Keep an eye on the dashboards and verify that alerts are triggered and notifications are sent when the defined conditions are met.
By following these steps, you can easily set up Prometheus and Grafana on Amazon EKS, enabling you to monitor your containerized applications effectively and get the most out of the powerful features of these open-source monitoring tools for metrics collection, visualization, and alerting.
How to Configure AWS EKS Cluster Metrics Collection with Prometheus
Before configuring Prometheus, it's essential to understand the metrics available in Amazon EKS. Essentially, AWS EKS exposes various metrics related to the cluster, nodes, pods, containers, and more. These metrics provide insights into the performance, health, and resource utilization in your AWS EKS environment.
With this in mind, let’s proceed;
3.1 Prometheus Configuration: Access the Prometheus configuration file, typically named prometheus.yml. This file contains the configuration settings for Prometheus, including the targets it should scrape metrics from.
3.2 Identify Target Services: Identify the services, pods, or containers from which you want Prometheus to collect metrics. Determine the appropriate endpoints or ports where these services expose their metrics.
3.3 Add Targets to Prometheus Configuration: In the prometheus.yml file, add the target endpoints under the scrape_configs section. Specify the job_name for the target, the scheme (HTTP or HTTPS), the static_configs with the appropriate targets (IP address or hostname), and the path where the metrics are exposed.
3.4 Relabelling and Filtering: Use relabelling and filtering techniques in Prometheus configuration to refine the collected metrics. You can modify labels, add new labels, or discard certain metrics based on specific conditions. This allows you to have more control over the collected data.
3.5 Restart Prometheus: After making changes to the Prometheus configuration, save the file and restart the Prometheus server for the changes to take effect. Ensure that Prometheus successfully reloads the updated configuration.
3.6 Verify Metrics Collection: Verify that Prometheus is collecting metrics from the specified targets. Access the Prometheus UI and navigate to the "Status" or "Targets" page to check the status of the targets.
Furthermore, ensure that the targets are marked as "UP" and that Prometheus is scraping the metrics correctly.
3.7 Explore Collected Metrics: Explore the collected metrics in the Prometheus UI. Use the query language, PromQL, to write queries and retrieve specific metrics. You can visualize the metrics, create graphs, and gain insights into the performance and behavior of your AWS EKS cluster and containerized applications.
3.8 Additional Configurations: Depending on your requirements, you may need to configure additional features in Prometheus.
This includes setting up alerting rules, configuring storage retention, enabling authentication and authorization, as well as integrating Prometheus with other monitoring and observability tools.
By following these steps, you can configure Prometheus to collect metrics from Amazon EKS and containerized applications. Prometheus provides a flexible and powerful open-source monitoring tool for gathering and analyzing metrics, allowing you to observe and gain insights into the performance and resource utilization of your EKS environment.
3.9 Prometheus Configuration File (prometheus.yml):
4.0 Relabelling and Filtering (Example - Relabel to Change a Label):
4.1 Restart Prometheus: Depending on your Prometheus deployment, you can use the following command to restart Prometheus:
4.2 Prometheus UI: Access the Prometheus UI by navigating to http://<Prometheus_IP>:<Prometheus_Port> in your web browser.
4.3 PromQL Query Example: Use PromQL to query and explore the collected metrics in the Prometheus UI. For example, to retrieve the CPU usage metric for the AWS EKS cluster, use the following query:
Note: Replace <IP_or_Hostname>, <Port>, <Prometheus_IP>, and <Prometheus_Port> with the appropriate values specific to your environment.
The code commands above provide an example configuration for Prometheus to collect metrics from an AWS EKS cluster or target service. Remember to adapt them according to your specific setup and requirements.
How to Create Dashboards in Grafana
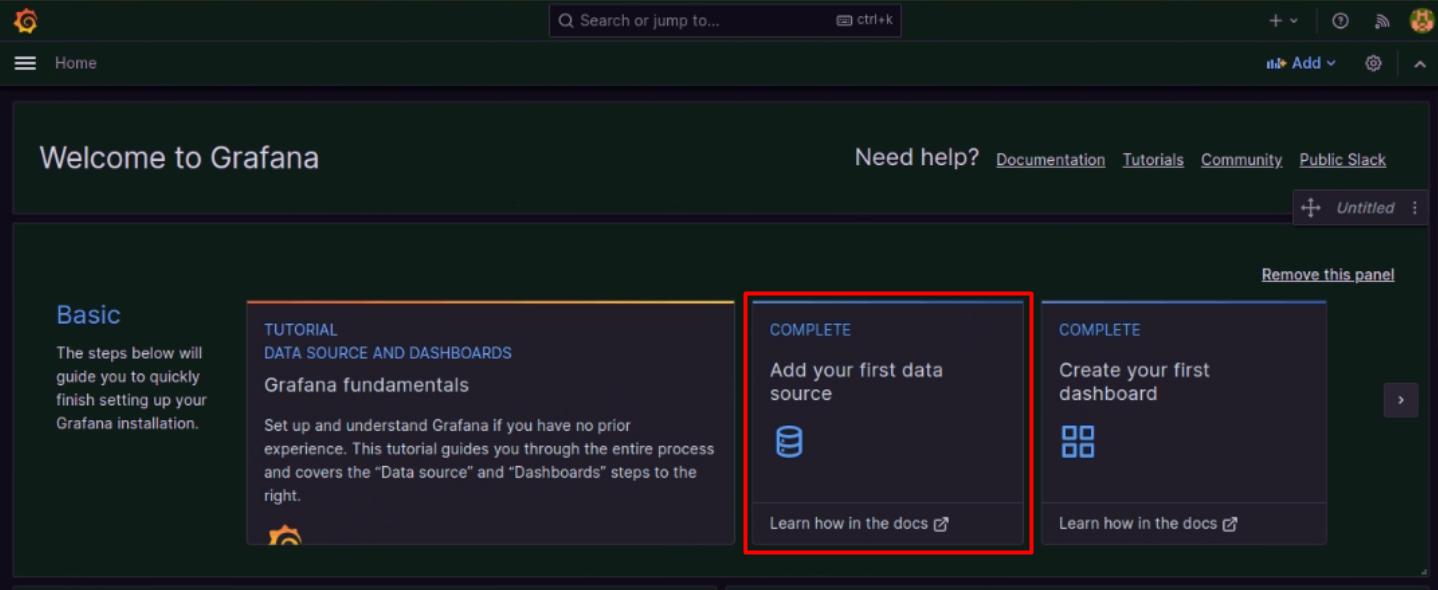
5.1 Access Grafana: Access the Grafana UI by navigating to http://<Grafana_IP>:<Grafana_Port> in your web browser. Log in using your Grafana credentials. If you do not have a defined password, the default is admin/admin

5.2 Configure Data Source: In the panel settings, under the "Metrics" tab, select the desired data source, which should be configured as Prometheus, in this case. Therefore, choose the appropriate Prometheus data source from the dropdown menu.
5.3 Create a New Dashboard: Click on the "Create" button or the "+" icon in the side menu to create a new dashboard.
5.4 Add a Panel: Click on the "Add panel" button on the top toolbar or the "Panel Title" dropdown and select the desired visualization type, such as Graph, Singlestat, Table, or Gauge.
5.5 Query Metrics: In the panel settings, under the "Metrics" tab, write a PromQL query to retrieve the desired metrics from Prometheus. Specify the metric name, labels, and any additional modifiers. Grafana provides a query editor to assist in constructing the PromQL queries.
5.6 Customize Visualization: Adjust the visualization settings according to your preferences. This includes customizing labels, axes, colors, legends, and other visualization-specific options available for the chosen visualization type.
5.7 Save the Panel: Once you're satisfied with the panel configuration, click on the "Apply" or "Save" button to save the panel.
5.8 Arrange Panels: Drag and drop the panels on the dashboard canvas to rearrange their positions. You can resize panels as needed to optimize the use of space.
5.9 Add Additional Panels: Repeat the steps above to add more panels and visualizations to the dashboard. You can create multiple panels to display different metrics or combine multiple metrics in a single panel.
6.0 Dashboard Variables: Utilize dashboard variables to create dynamic and interactive dashboards. Variables allow you to select different metric options or filter data based on specific criteria. Configure variables under the dashboard settings.
6.1 Dashboard Time Range: Adjust the time range of the dashboard to visualize data over a specific period. Select the desired time range from the time picker located at the top right corner of the Grafana UI.
6.2 Save the Dashboard: Once you have completed configuring the panels and customizing the dashboard, save the dashboard by clicking on the "Save" icon in the top toolbar. Be sure to provide a suitable name and description for the dashboard.
6.3 Share the Dashboard: Share the dashboard with others by using the "Share" feature in Grafana. Generate a shareable link or embed the dashboard in other platforms or websites for easy access.
Follow this link for an example code snippet for Grafana dashboard panel configuration.

This example shows a graph panel that visualizes the CPU usage metric for a specific namespace. Adapt the code based on your desired metric, labels, and additional visualization settings.
By following these steps and utilizing the provided code example, you can create custom dashboards in Grafana to visualize the collected metrics from Prometheus. Customize the panels, explore different visualization types, and organize the dashboard to effectively monitor and analyze your metrics data.
Implementing AWS EKS Alerting with Prometheus and Grafana
7.1 Access Grafana: Access the Grafana UI by navigating to http://<Grafana_IP>:<Grafana_Port> in your web browser. Log in using your Grafana credentials.
7.2 Create or Edit a Dashboard: Create a new dashboard or edit an existing one where you want to set up the alerting rules.
7.3 Add a Panel: Click on the "Add panel" button on the top toolbar or the "Panel Title" dropdown and select the desired visualization type for the alerting rule.
7.4 Configure Data Source: In the panel settings, under the "Metrics" tab, select the desired data source, which should be configured as Prometheus in this case. Choose the appropriate Prometheus data source from the dropdown.
7.5 Query Metrics: In the panel settings, under the "Metrics" tab, write a PromQL query to retrieve the metrics that you want to set alerts on. Specify the metric name, labels, and any additional modifiers. Make sure the query captures the condition for triggering an alert.
7.6 Set Up Alerting Rule: In the panel settings, under the "Alert" tab, configure the alerting rule by specifying the conditions for triggering the alert. Define the thresholds, comparisons, and duration that determine when the alert should fire. You can set up multiple alerting rules for different metrics or conditions.
7.7 Configure Alert Notifications: In Grafana, go to the "Alerting" section in the side menu and click on "Notification channels." Configure the notification channels for alerting, such as email, Slack, PagerDuty, or other available options.
Provide the necessary details, such as email addresses, API keys, or webhooks, to establish the connection with the desired notification method.
7.8 Enable Alerting: Ensure that the alerting feature is enabled in Grafana by going to the "Configuration" section in the side menu and clicking on "Settings." Under the "Alerting" tab, make sure the "Enable" option is checked.
7.9 Save the Panel and Dashboard: Once you have completed configuring the alerting rules and notifications, save the panel and dashboard by clicking on the "Save" icon in the top toolbar. Provide suitable names and descriptions for the panel and dashboard.
Here's an example code snippet for a Grafana alerting rule configuration:
This example sets up an alerting rule to trigger a warning when the average CPU usage in the "my-namespace" namespace exceeds 80% for at least 5 minutes. The alert includes labels to indicate the severity and annotations to provide a summary and description of the alert.
By following these steps and utilizing the provided code example, you can set up alerting rules and configure alert notifications for AWS EKS clusters using Prometheus and Grafana. Customize the alert conditions, notifications channels, and labels/annotations to suit your monitoring needs.
Ensure that the necessary notification methods are properly configured to receive alerts when the defined conditions are met.
AWS EKS Monitoring Best Practices
Define Monitoring Objectives: Clearly define your monitoring objectives before setting up Prometheus and Grafana on Amazon EKS. Determine the metrics and key performance indicators (KPIs) that are crucial for your applications and infrastructure. This helps you focus on monitoring what matters most and avoids collecting unnecessary data.
Plan Metric Collection: Plan the collection of metrics based on your monitoring objectives. Identify the metrics that provide insights into the performance, health, and resource utilization of your AWS EKS environment.
This includes cluster-level metrics, node metrics, pod metrics, container metrics, and application-specific metrics. Prioritize the metrics that are critical for your specific use case.
Monitor Cluster Health: Monitor the health of your AWS EKS cluster by tracking important cluster-level metrics. This includes metrics such as CPU and memory usage, cluster capacity, network throughput, and overall cluster availability.
Use these metrics to ensure that the cluster is running optimally and to identify any potential resource bottlenecks or performance issues.
Track Node and Pod Metrics: Monitor the metrics of individual nodes and pods to gain insights into their resource consumption and performance. Additionally, track CPU and memory usage, disk utilization, network traffic, and any custom application metrics that are relevant to your workloads.
This helps in identifying underutilized or overutilized resources and ensuring efficient resource allocation.
Create Custom Dashboards: Use Grafana to create custom dashboards that consolidate and visualize the collected metrics. Logically organize the dashboards, grouping related metrics together. Furthermore, create visually appealing visualizations such as graphs, charts, and gauges to provide clear and actionable insights.
Moreover, customize the dashboards based on the specific needs of your applications and stakeholders.
Set Meaningful Alert Thresholds: Establish meaningful thresholds for triggering alerts based on your desired levels of performance and availability. Avoid setting thresholds too high or too low, as it may result in false positives or missing critical issues.
In addition, continuously fine-tune the alert thresholds based on historical data and feedback from operations teams.
Implement Alert Suppression and Aggregation: Prevent alert storms by implementing alert suppression and aggregation mechanisms. For this, configure rules to suppress or aggregate similar alerts to avoid flooding your monitoring system with redundant notifications.
This helps reduce noise and improves the effectiveness of alerting.
Ensure Alert Responsiveness: Configure alert notifications to reach the right individuals or teams promptly. Set up multiple notification channels such as email, Slack, or incident management systems to ensure alerts are received and acted upon promptly.
Also, establish escalation procedures to ensure alerts are not missed or ignored.
Regularly Review and Refine: Continuously review and refine your monitoring setup. Similarly, regularly analyze metrics, dashboards, and alerting patterns to identify areas for improvement.
Incorporate feedback from operations teams and stakeholders to enhance the effectiveness of your monitoring and alerting system.
Monitor Application-Specific Metrics: In addition to infrastructure metrics, monitor application-specific metrics that are vital for your workloads. This may include metrics related to response times, error rates, throughput, or specific business transactions.
Monitor the metrics that directly impact the performance and user experience of your applications.
Ensure Scalability and High Availability: Design your Prometheus and Grafana deployment to ensure scalability and high availability. Consider using a scalable and resilient storage solution for Prometheus data to handle the growing volume of metrics.
Deploy Grafana in a redundant and distributed manner to avoid single points of failure.
Regularly Backup Configuration and Data: Take regular backups of your Prometheus and Grafana configuration files and data. This ensures that you can restore the system to a known good state in case of any failures or data loss.
Maintain backups off-site or in a separate storage location for added security.
By following these tips and best practices, you can establish an effective AWS EKS monitoring and alerting system using Prometheus and Grafana.
Adapt these recommendations based on your specific use case, application requirements, and organizational needs to achieve optimal monitoring and observability of your EKS environment.
Importance of AWS EKS Monitoring
There’s no downplaying the importance of AWS EKS monitoring for Development teams and businesses. Essentially, it facilitates;
Early Detection of Issues: Monitoring and alerting enable businesses to detect issues and anomalies in real-time, allowing them to take proactive measures to prevent service disruptions and minimize downtime.
By monitoring key metrics such as CPU usage, memory utilization, and network traffic, you can identify potential bottlenecks, resource constraints, or performance degradation before they escalate into critical problems.
Optimizing Resource Utilization: Monitoring metrics related to resource consumption, such as CPU and memory usage, disk utilization, and network traffic, helps businesses optimize resource allocation and utilization in their AWS EKS environment.
By identifying underutilized or overutilized resources, they can make informed decisions to optimize costs, improve performance, and ensure efficient scaling of their applications.
Capacity Planning and Scalability: Monitoring and tracking historical data using Prometheus and Grafana allow businesses to analyze trends and patterns, enabling effective capacity planning and scalability.
By identifying growth patterns and anticipating resource requirements, businesses can scale their AWS EKS environment in a timely manner, ensuring adequate capacity to handle increasing workloads and user demands.
Performance Optimization: Monitoring and analyzing metrics related to application performance, latency, response times, and error rates enables you to optimize the performance of your containerized applications.
By identifying performance bottlenecks, you can make targeted optimizations, fine-tune configurations, and improve the overall user experience.
Ensuring High Availability and Reliability: Monitoring and alerting help companies ensure high availability and reliability of their applications running on Amazon EKS.
By setting up alerts based on predefined thresholds and conditions, you can promptly identify and address potential issues, minimizing the impact on end-users and maintaining a high level of service availability.
Conclusion
AWS EKS monitoring and alerting play a vital role in ensuring the smooth operation, performance, and reliability of containerized applications. By implementing a robust monitoring and alerting system using Prometheus and Grafana, businesses can gain valuable insights into their AWS EKS infrastructure and proactively detect and address issues before they impact their applications and end-users.
Prometheus, an open-source monitoring tool, combined with Grafana's powerful dashboarding capabilities, provide a comprehensive monitoring and observability platform for Amazon EKS. Prometheus enables the collection and storage of metrics from various sources within the AWS EKS cluster, while Grafana offers a user-friendly interface for visualizing and analyzing these metrics through customizable dashboards.
You may also be interested in:
How to Manage Code Quality with SonarQube and GitHub Actions
Docker vs Containerd: A Detailed Comparison
Best AI Programming Languages: A Review of the Top 10
How to Install Checkov for IaC Scanning: The Complete Guide
How to Run a Container on AWS ECS: A Step-by-Step Guide
More cost-effective than hiring in-house, with Nearshore Boost, our nearshore software development service, you can ensure your business stays competitive with an expanded team and a bigger global presence, you can be flexible as you respond to your customers’ needs.
Learn more about our services by booking a free consultation with us today!


