%20(1)%20(1).png)
We're seeing more and more tools that enable you to create software architecture and other Diagrams as Code. The main benefit of using this concept is that majority of the Diagrams as Code tools can be scripted and integrated into a built pipeline for generating automatic documentation. The other benefit responsible for the growing use of Fiagrams as code to create software architecture is that it enables the use of text-based tooling, which most software developers already use. Furthermore, text is easily version controllable and diff’able.
Table of Contents
What is Diagrams as Code?
In early 2020, Korean developer MinJae Kwon decided to create Diagrams. Diagrams allows you to draw cloud system architecture in Python code, allowing you to track your Diagram in any SCM. It supports major providers such as AWS, Azure, GCP, Kubernetes, OpenStack, Oracle Cloud, etc. but support drawing on-premise infrastructure as well.
How to Install Diagrams
Requirement: Python 3.6 or higher
Depending on your environment, run one of those commands below:
How to Use Diagrams
You must import the necessary modules you want to add to your diagrams. They are called Nodes. They represent a node or system component. Nodes are composed of three parts: Provider, Resource type, Name.
You can import OnPrem, AWS, Azure, GCP, Kubernetes nodes, and more. If you aren't able to find something, you could always use this custom module.
In the above example, the LoadBalancing is a node of the Network resource type provided by the GCP provider.
Custom Graphviz dot attributes options are supported. graph_attr note_attr and edge_attr can be used.
Reference link: https://www.graphviz.org/doc/info/attrs.html
Diagram represents a global diagram context.
show=False Will disable the automatic file opening when you generate the diagram.
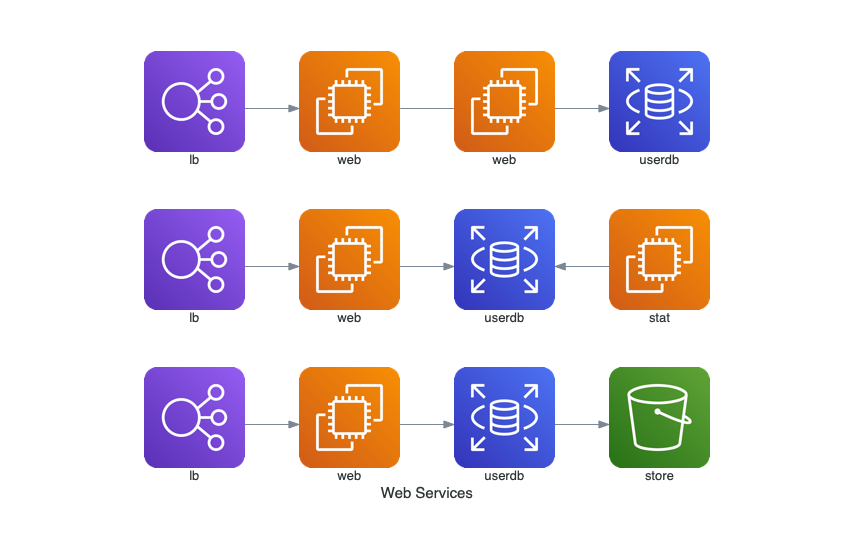
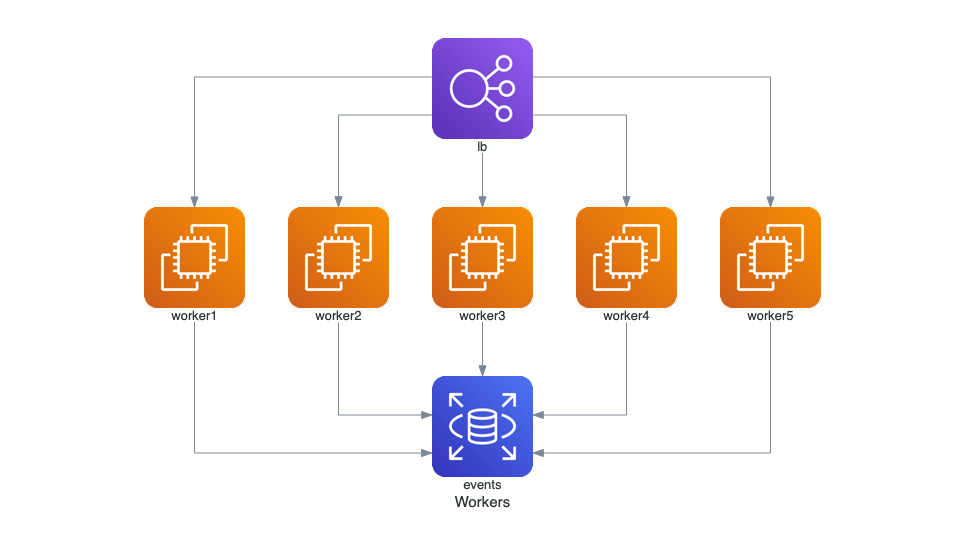
Data Flow and how to connect nodes together:
>> Connect nodes in the left to the right direction.
<< Connect nodes in right to left direction.
- Connect nodes in no direction. Undirected.
You can change the data flow direction with the direction parameter. Default is LR. (Left to Right)
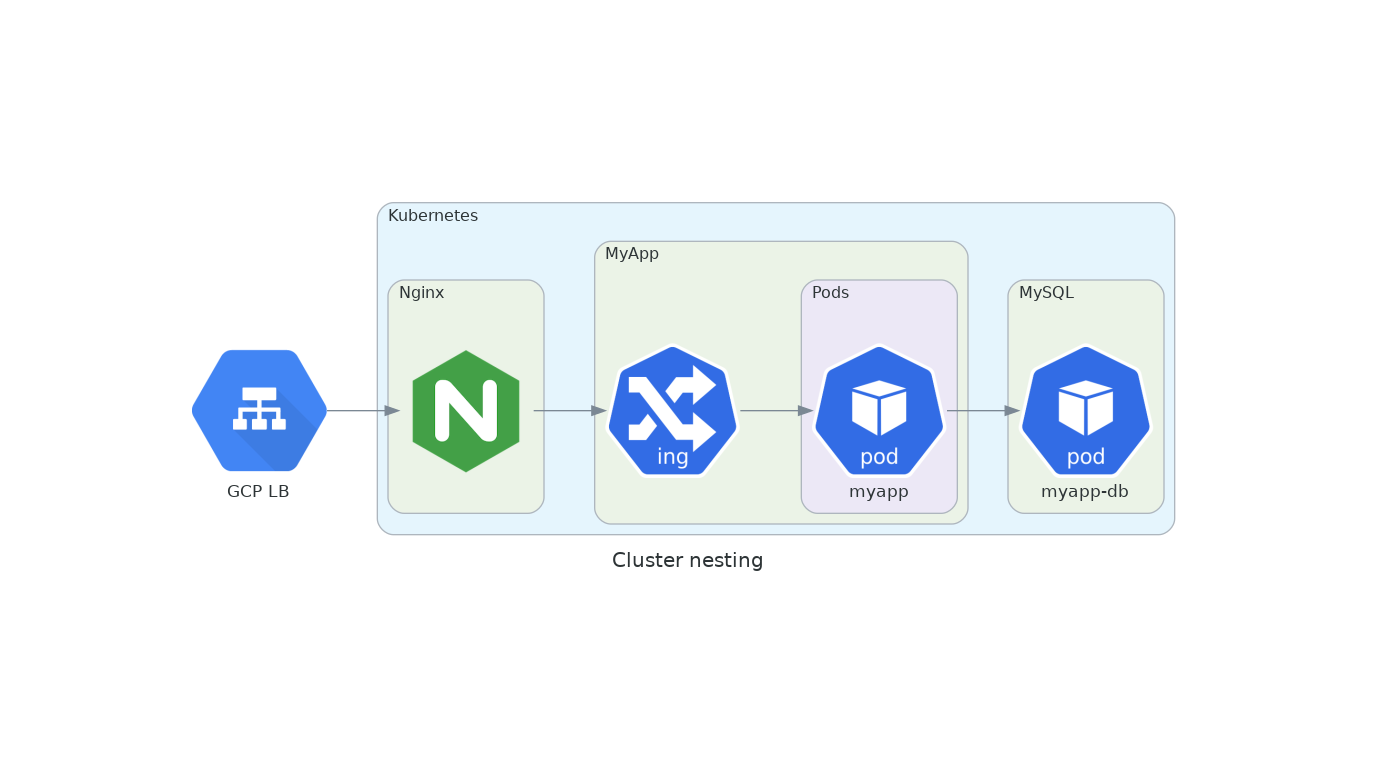
Clusters allows you to group the nodes in an isolated group. You can create a cluster context with Cluster class. And you can also connect the nodes in a cluster to other nodes outside a cluster. There is no depth limit of nesting so that you can imagine the possibilities.
Edges represent a link between Nodes. It contains three attributes: label, color, and style.
https://diagrams.mingrammer.com/docs/guides/edge
Custom node
We usually import icons externally hosted so they can be accessed when we generate the diagrams.
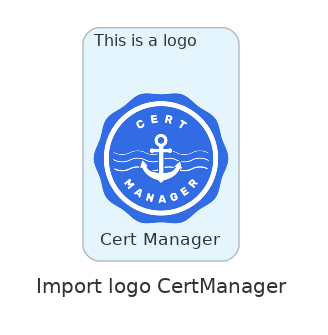
If you want to import local icons saved in your repository, please review the example here.
Generate the diagram
Once you're happy with the code, generate the diagram by running the command bellow which will create a .png version of your diagram.
Conclusion
Diagrams by Mindgrammer isn't the only option out there with Cloudgram, PlantUML, or even Draw.io having similar functionality of saving the XML generated in Git. We clearly do not lack options with open-source tools to create diagrams. Similarly, Python is so overly present that learning how to use Diagrams wasn't a steep learning curve.
At Bluelight, we create Diagrams for our clients during the discovery phase using Diagrams by Mindgrammer. It has been accelerating our discovery process and allows anyone in our team to jump in and quickly update the Diagram through version control.
You may also be interested in:
Nearshore Staff Augmentation: Top 4 Benefits for Businesses
What is Kubecost: The Complete Guide
The Complete React Developer Salary Guide for 2022
A Detailed Overview of the Top 11 AWS Certification Courses
The Ultimate DevOps Hourly Rate Guide for 2022
Redux Toolkit with Typescript: How to Get Started
What is DevSecOps: Top 5 Automation Tools for CI Pipelines
More cost-effective than hiring in-house, with Nearshore Boost, our nearshore software development service, you can ensure your business stays competitive with an expanded team and a bigger global presence, you can be flexible as you respond to your customers’ needs.
Learn more about our services by booking a free consultation with us today!


